Randolph Diagrams
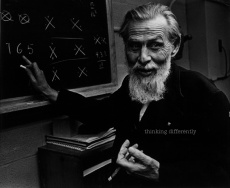
There is something aesthetic and elegant about Randolph diagrams, unfortunately they aren’t commonly used. I found out about them when reading Embodiments of Mind by the glorious and bearded Warren McCulloch.
The Original Proposal:
In the book he refers to them as “Venn functions” and they are briefly explained as being derived from Venn’s diagrams for sets but in McCulloch’s case they were used to express logical statements. If you draw a Venn diagram of two circles intersecting you are left with four spaces ( a/b, a&b, b/a, U ), adding a jot into a space to denote truth or leaving it blank for false gives you the 16 possible logic combinations. They are great examples of the isomorphism between logic and set theory:
In the book he refers to them as “Venn functions” and they are briefly explained as being derived from Venn’s diagrams for sets but in McCulloch’s case they were used to express logical statements. If you draw a Venn diagram of two circles intersecting you are left with four spaces ( a/b, a&b, b/a, U ), adding a jot into a space to denote truth or leaving it blank for false gives you the 16 possible logic combinations. They are great examples of the isomorphism between logic and set theory:
 He
used these as tools to help teach logic to neurologists, psychiatrists
and psychologists. Later he developed them into a probablistic logic
which he applied to John vonn Neumann‘s logical neuron nets. Which I will discuss in the next post.
He
used these as tools to help teach logic to neurologists, psychiatrists
and psychologists. Later he developed them into a probablistic logic
which he applied to John vonn Neumann‘s logical neuron nets. Which I will discuss in the next post.McCulloch does mention that they could be used to apply more than two statements but doesn’t show how, later John F. Randolph developes the system as an alternative visualisation of set relations neatly coping with more than two sets (something Venn diagrams begin to struggle with after five). For each additional statement/set a new line is introduced in each quadrant. Four statements would be a large cross with four smaller crosses, one in each quadrant.
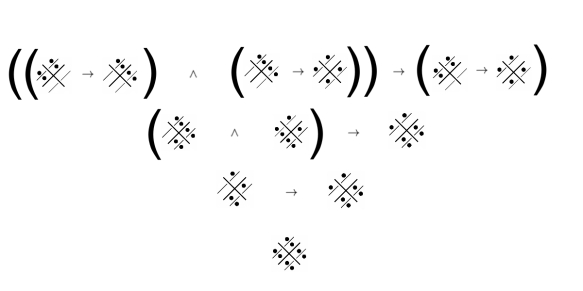
Wikipedia has an example of the tautological proof for the logical argument, modus ponens, which can be found here, but I thought it would be good to show how three values are handled – so we’ll use syllogism, as in “Socrates is a man, all men are mortal, therefore Socrates is mortal” being reduced in it’s logical form to tautology:


No comments:
Post a Comment